From Thoughts to Watts

Where does your brain’s energy go? A brain atlas offers answers.
This story originally appeared in Yale Engineering magazine.
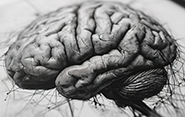
A conscious human brain takes up a lot of energy. Powering thoughts, memories, and every conscious moment, the human brain, a mere two percent of our body weight, consumes nearly a quarter of our body’s glucose—that’s what kickstarts the brain’s fuel system.
“Along with a few other labs around the world, we’ve observed that brain activity is very energy-demanding,” said Fahmeed Hyder, professor of biomedical engineering & radiology and biomedical imaging. “It consumes a lot more energy than what the size of that organ would indicate.”
Every living brain has its own internal rhythm of activity created by periodic electrical discharges. Over time, that rhythm can vary across regions due to numerous factors, both in health and in disease. But exactly how these rhythms of brain activity and spatial distribution of brain energy vary is unclear. To get a better understanding of this, Hyder and his collaborators created a 3-dimensional brain energy atlas. Working with researchers at Fudan University in China, Hyder’s aim for the atlas is to serve as the next generation of neuroscientific tools — a reference that explains exactly how much and where in the brain this energy is being consumed. Developed computationally, or in silico, a 3D energy map brings not only a better understanding of the brain’s inner workings, but potentially better ways to study and treat Parkinson’s disease and other brain-related maladies.
 The researchers, who published their results recently in Cerebral Cortex, used positron emission tomography (PET) scans to measure the glucose oxidation of healthy subjects’ “resting” brains (awake, eyes closed, with no cognitive tasks assigned). With this, they created a map of how much and where the brain processes glucose to produce adenosine triphosphate (ATP), the cells’ main fuel source. Combining that map with existing maps of cellular and synaptic densities of other healthy subjects, Hyder and team assembled an atlas that charts the brain’s energy consumption with unprecedented precision given the cellular architecture of the healthy brain. With their model, the researchers were able to determine that much of the brain’s electrical activity clocks in at about 1.2 Hz — surprisingly close to the rare in vivo measurements of human brain activity made in neurological patients.
In future work, the researchers plan to apply the model to other brain states (with eyes open, for example, or under sedation).
Calling it the Brain Energy Atlas, the researchers have made their atlas publicly available as a toolbox for other scientists in the field to gain new insights into the energy workings of both healthy and diseased human brains.
Much of what we currently know about shifts in the brain’s internal rhythm of electrical activity comes from animal studies. That’s because in vivo measurements of such electrical signals requires invasive electrodes, which are not feasible in the human brain. The Brain Energy Atlas provides a way to noninvasively estimate the human brain’s internal rhythm of electrical activity.
It also opens the way toward simulating effects of various diseases that can affect specific ways that the brain consumes energy. For instance, depression can decrease the brain’s pumping of sodium and potassium across the cell membrane. Now researchers can pinpoint such outcomes by comparing in silico predictions with in vivo measurements of brain metabolism.
The atlas takes into account what are essentially the brain’s software and hardware components. The software is made up of the electrical signals that the brain processes. The hardware is the neuropil, composed of neuronal and glial cells with their associated synapses (that is, cellular and synaptic densities), which facilitates the electrical signals. Some regions of the brain have higher neuropil density, while others have higher neuronal activity. These variations make for a very complex interplay between the brain’s hardware and software. The atlas Hyder and his team created captures that complexity.
Taking on this aspect of the brain is an arduous process that involves a lot of very dense calculations, something that has limited the number of labs delving into the field.
“There are billions of neuronal/glial cells that consume billions of molecules per second,” Hyder said. “But it’s very important to estimate these exactly, because it tells us: How far off are we in our understanding of what these cellular needs are?”
Specifically, Hyder’s team is looking at ATP, the source of energy at the cellular level, and how much of it is needed by cells at the synaptic level and beyond. They’ve been able to determine that there’s some metabolic heterogeneity — that is, some cells need more ATP than others. In doing so, they were able to create an “energy budget” of the brain — something that doesn’t just determine how much energy the brain needs, but how much the brain is spending on each cellular and synaptic function.
“We can look at the amount of energy devoted to electrical activity versus the amount to non-signaling activity,” said Adil Akif, a biomedical engineering graduate student in Hyder’s lab, and a co-author of the study. “Or we can look at the amount of energy being used by synapses versus neurons. This energy atlas that we’ve developed allows us to ask in-depth how this crucial resource is used and distributed throughout the brain.”
It’s a question that could only be asked in the last 15 or so years, thanks in part to the BigBrain Project. That, in turn, is the work of a team of Canadian and German scientists who sliced a human brain into 7,400 sheets and then digitally reconstructed it to create a very high-resolution, 3D cellular map of the human brain.
 A few years later, labs at Yale and a few others in the world developed PET measurements of synaptic density, a crucial component of Hyder and team’s Brain Energy Atlas. Further, they teamed up with researchers in Denmark to conduct quantitative measurements of glucose oxidation in the brain.
With these very large sets of data, they can now look into the origin of the brain’s metabolic variations. Besides shedding light on longstanding questions about the human brain, the project may lead to better and more individualized treatment of brain diseases. For example, Hyder said, if a brain lesion suggests that it could be caused by either neurodegeneration or by gliosis, typical medical imaging won’t determine the origin.
“But using our budgets, we can ask ‘What if this lesion was purely due to neuronal degeneration?’ We can test that to give us a more cell-specific idea of the origin of these metabolic dysfunctions.”
Armed with that knowledge, doctors can then determine the best course of therapy.
The brain is a complicated and mysterious organ, and Hyder acknowledges that there’s a lot more to learn about how it works. He hopes that the Brain Energy Atlas will be more widely adopted within the field and used for new studies that will shed more light on brain energetics.
“This field of energy budgets of cells has been a very small subfield in neuroscience, but the true meaning and the true purpose of that field really has been a question mark,” he said. “Other steps will have to follow, but this study is that one first step.”

