
Website Provides Crucial Early Information on COVID Outbreaks
A new website allows the public to get up-to-date information on COVID-19 infections in several regions of the state, including days-in-advance predictions based on sewage samples.
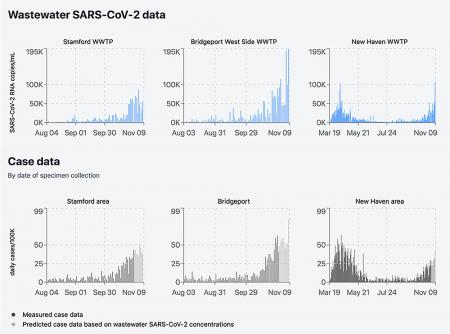
The Yale COVID-19 Wastewater Tracker, which went online this week, features the results of research that measures and reports daily concentrations of coronavirus RNA at Connecticut wastewater treatment facilities. It covers nearly one million residents in the Stamford, Bridgeport, New Haven, Hartford, New London, and Norwich regions. When there’s an outbreak in a community – like the one currently happening in New Haven and other state regions – it’s critical for the public to have as much information as possible, said Jordan Peccia, the Thomas E. Golden, Jr. Professor of Chemical & Environmental Engineering.
 “We want to get the data out as much as we can,” said Peccia, who’s leading the project. “Our intention is certainly for public health directors and people at the state to look at it, but we also want teachers, principals, church leaders and parents looking at it. We want everyone to be aware and up-to-date with what’s going on with COVID-19 in their city.”
The project works on the principle that people with an active infection can excrete the COVID-19 virus in their feces, which ends up at area wastewater treatment plants. Samples collected from the solid waste that settles from the wastewater are then analyzed at Peccia’s lab and at the Connecticut Agricultural Experiment Station (CAES). Researchers have been testing samples from New Haven since March and the other locations since August, and results of these tests closely mirror the levels of COVID-19 infections as reported by health officials in the state. However, infection trends emerge about five days earlier in the wastewater data.
“This is just another tool that people can use, and because it shows up a little earlier, we think it can beh helpful,” he said.
Analyzing wastewater also eliminates the question of whether results are influenced by how much testing is being conducted.
“You can look at the case data and see an increase, and some people might say ‘Well maybe they’re just testing more people.’ But wastewater doesn't care if you're testing or not.”
Albert Ko, department chair and professor of epidemiology at the Yale School of Medicine, noted that the website is one more way to get ahead of outbreaks. When an increase in transmissions is detected, a community can preemptively implement interventions.
“Citizens themselves can be aware of what their local situation is in terms of transmission and can then react appropriately to that,” he said.
Peccia’s aim for the sampling technology and the website go beyond Connecticut, particularly to places without much testing. In such areas, the predictive results could be especially critical to public health.
“We have our eyes on two things - we want to help Connecticut, but we also want to build the protocols, the algorithms, and fundamental science to help the world with this virus and with viruses to come,” Peccia said. “We’re hoping that this new site marks a clear example of how this work could be done, especially where we don't have a lot of testing, such as in the developing world.”
Peccia’s lab is leading the project in collaboration with CAES, the CT Department of Public Health, the Yale School of Public Health, and the six municipalities. The work is funded with a grant from the U.S. Centers for Disease Control and Prevention.
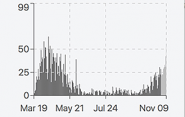
The website, which was created by Sarim Abbas ’20, a design fellow at the Center for Engineering Innovation & Design, features graphs for each area served by the treatment plants in the project. There are also graphs illustrating the number of infections provided by health officials for the same areas of the state. It also provides data that predicts COVID levels several days in advance. This data is generated by a computer model based on a statistical analysis of the wastewater samples.
Because of the day-to-day variability in the data, the information isn’t so much a daily forecast, but an indicator of general trends in the area. Because of that, Peccia advises users to look at the overall patterns.
“People checking the wastewater results should first scan the data,” he said. “Pick out the city you’re interested in and see if it’s going up or down.” They should then compare those patterns to other area graphs and to the cases reported by health officials.