
A Device to Easily Measure the Air You're Breathing
Once again, the students of Engineering Innovation & Design (ENAS 118) have produced a number of innovations while working their clients - the people who encounter these issues regularly and simply want a better way to tackle them. Taught by SEAS senior research scientist Larry Wilen and SEAS Deputy Dean Vince Wilczynski, most of the work took place in the John Klingenstein '50 Design Lab at the Center for Engineering Innovation & Design (CEID), although some students worked remotely from various locations around the globe. Today, we feature a device that allows anyone to monitor the air quality of their immediate surroundings.
Air quality can vary greatly from one environment to the next - from one home to the next, or from neighborhood to neighborhood. The student team of Henrik Kaellenius, Thomas Cirrito, Daniela Flores-Torres developed small, portable particle detectors that can be used to easily measure air quality. The students worked with Drew Gentner, Associate Professor of Chemical & Environmental Engineering and the Environment, and Katherine Schilling, research scientist in Chemical and Environmental Engineering.
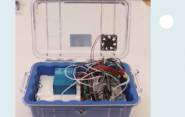
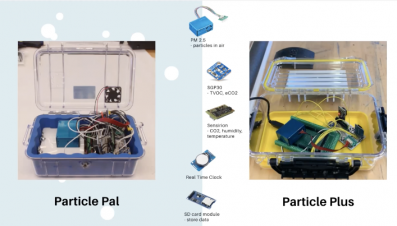 The team created a device, the “Particle Pal,” which contains a sensor that measures particles in the air in micrometers, and an SD card to store the data. A clock timestamps the files so users know when the data was collected. The device also allows the user to change the settings, such as the time intervals. With the goal of making the device user-friendly and durable, the team enclosed the technology in a small and sturdy box.
They also created a larger device, the “Particle Plus,” which has two additional sensors. In addition to particle counts, the device can measure volatile organic compounds in the air - these are impurities that can be present during household activities cooking with oil, or painting. It can also measure carbon dioxide, ethanol, hydrogen, temperature, and relative humidity.
To collect and analyze the data, users place the SD card into a computer, and the data can then be copied to a spreadsheet. With graphs users can see the number of particles over time, and their range of sizes.